| Guideline: Logical Perspective Views |

|
 |
|
IntroductionVarious viewpoints and diagrams/models are used in documenting the system at the logical level, namely the Logical Entity Model, the Logical Process Model, the Logical Locations Model and the Logical Roles Model. Each of these "models" or viewpoints may be documented using several types of diagrams.
The following overview is organized by viewpoint / aspect:
Logical Entity ModelDiagrams used in the logical entity model, which essentially add more detail to the business-level model, are:
Class DiagramClass diagrams show general associations, aggregations and generalizations between logical entities. The following kinds of class diagrams might be of interest in the context of the logical entity model:
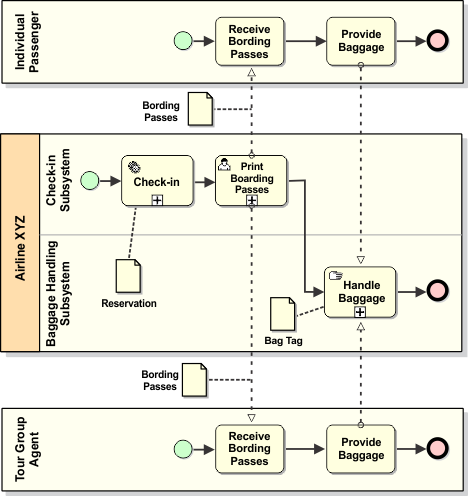
The class diagram below shows a partial view of the logical entities involved in the airport example.
It shows generic structures in the logical entity model, but entities can also be part of the documentation of the logical process model by showing how logical entities participate in logical activities as shown below (i.e. Boarding Passes, Reservation and Bag Tag).
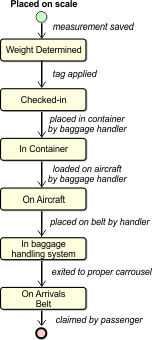
A diagram showing activities and entities participating in the activity Check-in. State DiagramA state diagram is used to illustrate the possible states that a logical entity may be in along with the events that cause a transition from one state to another and the actions that result from a state change. A state diagram often simplifies the validation of the design.
The logical entity baggage described with a state-chart diagram. Logical Process ModelDiagrams used in the logical process model are:
Activity DiagramAn activity (or collaboration) diagram is used to detail a workflow and optionally how logical entities are used. This diagram may have the following elements:
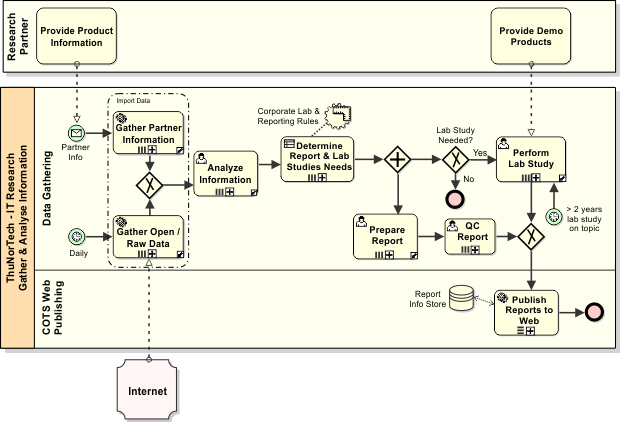
The diagram above is an activity diagram for the ThuNorTech process Gather and Analyze Information. Notice that at the logical level different types of tasks are defined along with specific gateways, rules and events. Nested and Partitioned Activity DiagramsActivity diagrams may be partitioned to separate the workflow into logical groupings using either Pools (i.e. representing "participants") or Lanes (i.e. representing roles, systems or organizations). This is illustrated in the example above where the Pool represents the "organization" "Gather & Analyze Information" that is subdivided into lanes representing the Publishing "system" and the Data Gathering "system".
An activity may reference another activity diagram, which shows the internal structure of the activity—in other words
the activity is a "collapsed subprocess" in BPMN terms where the encapsulated detail has been defined in another
diagram. As shown in the diagram above the "drill down" decorators ( Entities on Activity DiagramsDetails may be optionally added to activity diagrams showing the (logical) entities involved in the workflow and used by activities. The Check-in activity diagram above includes the entities participating in the activity. Logical Location ModelDiagrams used in the logical locations model are:
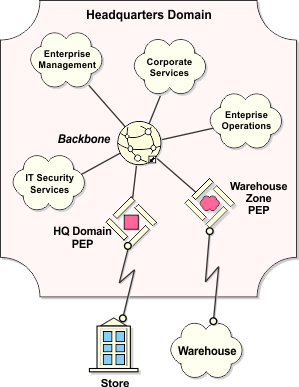
Logical Locations ModelA Logical Locations Model defines the locations aspect of the IT architecture. At the logical level, the locations model is mainly concerned with modeling the logical locations at which the "system" (or backbone) has a presence, the communications between these locations and the activities supported at these locations. The locations model is also concerned with security aspects, and illustrates how the various locations are structured and connected to support both the system requirements, and to address IT security requirements—at least at a very high-level through the definition of domains and zones. See Whitepaper: A Reference Model for Enterprise Security. An example of this is shown below.
This shows the next level of detail from the diagram shown in Business Perspective Views. It is a more detailed view of the Headquarters domain. The Store and Warehouse are just shown for context. The headquarters of the enterprise is divided into a number of zones, with services having similar levels of information (and therefore similar sensitivity from an IT security perspective) grouped together. They are also grouped from a cohesion perspective as well, since for example HR or Financial processes and tasks have a lot of interaction with each other. Also shown are a domain policy enforcement point and a zone policy enforcement point that respectively provide the policy separation between headquarters and these locations.
Further detail is defined for the network "backbone" (as indicated by the "drill down" decorator
As one can gather from this example the modeling language for the Logical Locations Model has a complete set of elements that are used to define this aspect in as much detail as required. Logical Roles ModelDiagrams used in the logical roles model are:
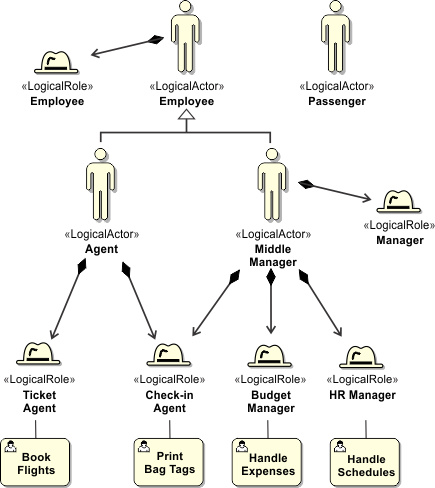
Roles Summary DiagramA roles summary diagram is used to detail the structure of Actors and also of Roles. It also shows the relationships between Actors & Roles and logical activities. At the business level roles model was very simple, but at the logical level the architectural decision required to detail roles are made (i.e. automation vs. manual vs. interactive)—with this analysis and details being defined at the logical level the roles are properly defined. The main objective of the logical roles model (once the set of roles is defined) is to understand the structure of the roles and actors in the Summary Diagram. This structuring supports two objectives:
This diagram is used to define the structure of roles and actors that interact with the system, which is important to do at the logical level, as noted above. This structure reveals how the GUIs or interfaces to the system's activities are shared or used, by the various roles, or by specific (or generalized) actors with the system.
For example, if required and useful, a diagram similar to the above could be produced to illustrate the roles assumed by various employees or classes of employees, within the system. The structure defined here has direct implications on the system and technical level solutions in terms of how logical activities collaborate, and on the IT security measures required to secure the more sensitive logical activities.
In this example a Middle Manager actor is shown (and stereotyped as <<LogicalActor>>) as assuming the following roles:
Note that all roles interact with and are defined by "Analyze User Activities" or "Manual Activities". Roles in ContextA "roles-in-context" diagram is used to detail the interactions of roles and actors with the activities in the system. This example diagram is similar to the one above, the ThuNorTech process Gather and modeling Information, but is a simplified version showing only the relevant activities and with extraneous information removed, but with the roles added.
|


| © David W. Enstrom, 2025. All rights reserved. |